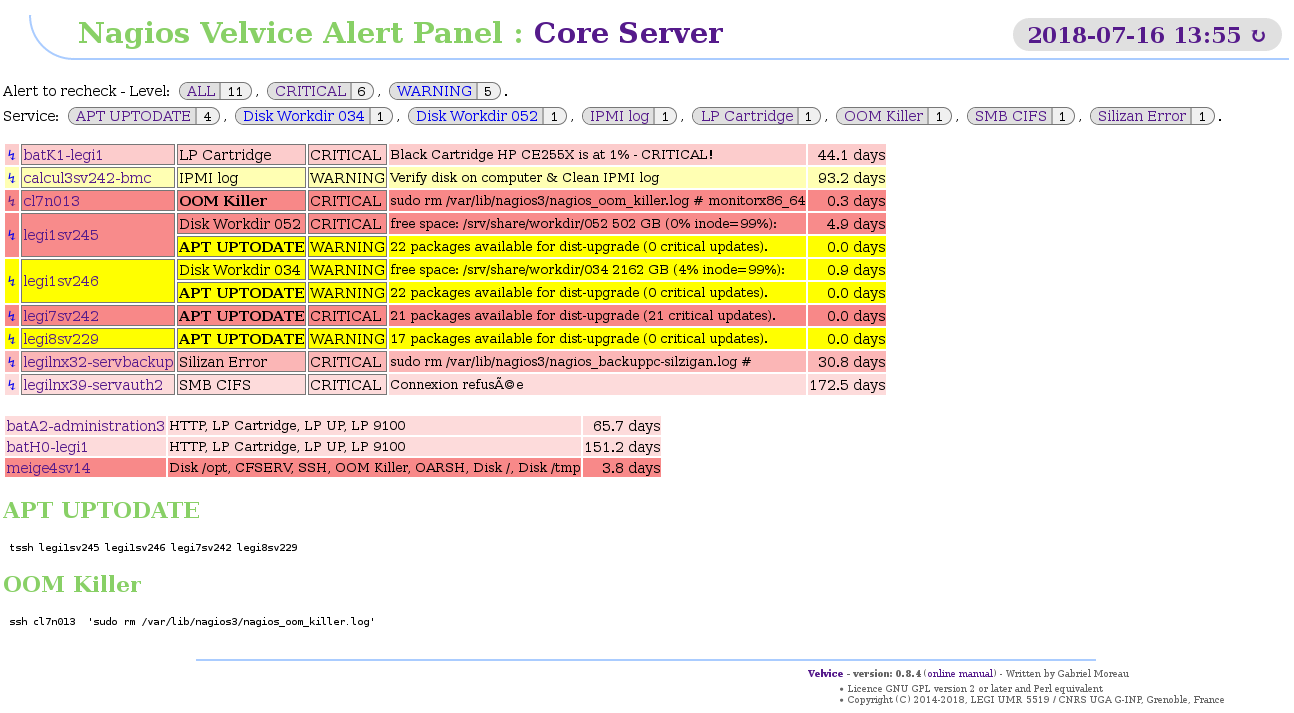
velvice.cgi - nagios velvice alert panel
 velvice.cgi
 velvice.cgi?check=XXX
Nagios VELVICE is an acronym for "Nagios leVEL serVICE status".
The Nagios web page is sometimes very graphically charged and does not necessarily contain the information you need at a glance. For example, it is quite complicated to restart controls on multiple hosts in one click.
For example, a server that is down should take only one line and not one per service... Similarly, a service that has been down for 5 minutes or since yesterday has more weight than a service that has fallen for 15 days.
With Velvice Panel, a broken down server takes only one line. Services that have been falling for a long time gradually lose their color and become pastel colors.
With Velvice Panel, it is possible through a single click to redo a check of all services that are in the CRITICAL state. Similarly, it is possible to restart a check on all SSH services in breakdowns ... In order not to clog the Nagios server, checks are shifted by 2 seconds in time.
There is also a link to the web page of the main Nagios server. For each computer, you have a direct link to its dedicated web page on this server.
The configuration file must be /etc/nagios3/velvice.yml. This is not a required file. The file is in YAML format because this is a human-readable text file style. Other formats could have been Plain XML, RDF, JSON... but they are much less readable.
You can find in the software nagios-velvice an example of configuration: velvice.sample.yml. This one is in fact the master reference specification!
The main keys nagios-server and color-downtime have good default values. No secondary key is required... The Velvice script try hard to replace ~ by the good value automatically.
 nagios-server:
   status-file: /var/cache/nagios3/status.dat
   nagios-cmd:  /var/lib/nagios3/rw/nagios.cmd
   portal-url:  ~/nagios3/
   status-cgi:  ~/cgi-bin/nagios3/status.cgi
   stylesheets: ~/nagios3/stylesheets
The background color of the faulty service line display remains stable with a bright color for at least 3 days. Then, it decreases and becomes pastel after 53 days with an intensity of 70% (100% is white and 0% is black).
 color-downtime:
   day-min:  3
   day-max: 50
   factor:   0.7
With key host-mapping, it's good to map localhost to the real name of the computer (hostname).
 host-mapping:
   localhost:  srv-nagios
   toto:       titi
The only important key is remote-action. You can affiliate as many subkeys as you want. Let's take an example:
 remote-action:
   oom-killer:
     regex: ^OOM Killer
     title:  OOM Killer
     command:     tssh -c 'sudo rm /var/lib/nagios3/nagios_oom_killer.log' %m
     command-one: ssh %m 'sudo rm /var/lib/nagios3/nagios_oom_killer.log'
     depend: ^SSH
     status: ALL
     style: bold
oom-killer is just a key for your remote action. The regex is used to find which service has a problem... The title is use in the result web page (not mandatory - otherwise, it will be Action: oom-killer). The command is just written on this web page. You have the responsibility to copy / cut it on a terminal. For security reasons, the nagios server does not have the right to launch the command on the remote host. The wildcard %m is replaced by the list of the host (separated by the space). Sometime, the command could be different if there is only one computer (just SSH and no parallel SSH). If your command is based on SSH, you can have an SSH action only if the remote SSH is running. So you can make the remote action depend on the SSH service through a regular expression of your choice.
The last two keys. The status key is for CRITICAL or WARNING (or ALL). The key style is there to mark in bold the service in error on the web page.
The web page will be partially updated every 15 minutes by default (if Javascript is enabled in your browser). It is possible to have a finer setting depending on the time of day and the day of the week by using Perl objects DateTime::Event::Recurrence via some YAML parameters in the configuration file. See the sample configuration file velvice.sample.yml for a very detailed case. With the following configuration, the refresh of the web page will take place every 5 min (300 s) from 9 am to noon and from 1 pm to 6 pm from Monday to Friday. From noon to 1 pm and from 6 pm to 8 pm on weekdays, this will take place every 10 minutes.
 refreshments:
   -
     refresh: 300
     days:  [ 1 .. 5 ]
     start: [  9, 13 ]
     end:   [ 12, 18 ]
   -
     refresh: 600
     days:  [ 1 .. 5 ]
     start: [ 12, 18 ]
end: [ 13, 20 ]yamllint(1), ysh(1), YAML, Nagios::StatusLog, Color::Calc, DateTime::Event::Recurrence
In Debian GNU/Linux distribution, packages for yamllint and ysh are:
yamllint - Linter for YAML files (Python)
libyaml-shell-perl - YAML test shell (Perl)
Own project ressources:
$Id: velvice.cgi 389 2019-06-07 09:38:37Z g7moreau $
Written by Gabriel Moreau <Gabriel.Moreau(A)univ-grenoble-alpes.fr>, LEGI UMR 5519, CNRS, Grenoble - France
Licence GNU GPL version 2 or later and Perl equivalent
Copyright (C) 2014-2019, LEGI UMR 5519 / CNRS UGA G-INP, Grenoble, France