
TracNav
- Tutorial2: Projection objects
- Tutorial1: Image display
- Tutorial3: Geometric calibration
- Tutorial4: Processing image series
- Tutorial5: Correlation Image Velocimetry: a simple example
- Tutorial6: Correlation Image Velocimetry: optimisation of parameters
- Tutorial7: Correlation Image Velocimetry for a turbulent series
- Tutorial8: Correlation Image Velocimetry: advanced features
- Tutorial9: Image Correlation for measuring displacements
- Tutorial10: Image Correlation for steroscopic vision
- Tutorial11: Correlation Image Velocimetry with 3 components
- Tutorial12: Comparaison with a Numerical Solution
Tutorial / Projection objects
Projection objects are used in various ways for image or field analysis, as shown in the following examples. Let us choose now a color image as input, UVMAT_DEMO02_color/images/frame1.jpg'.
Plotting a luminosity profile
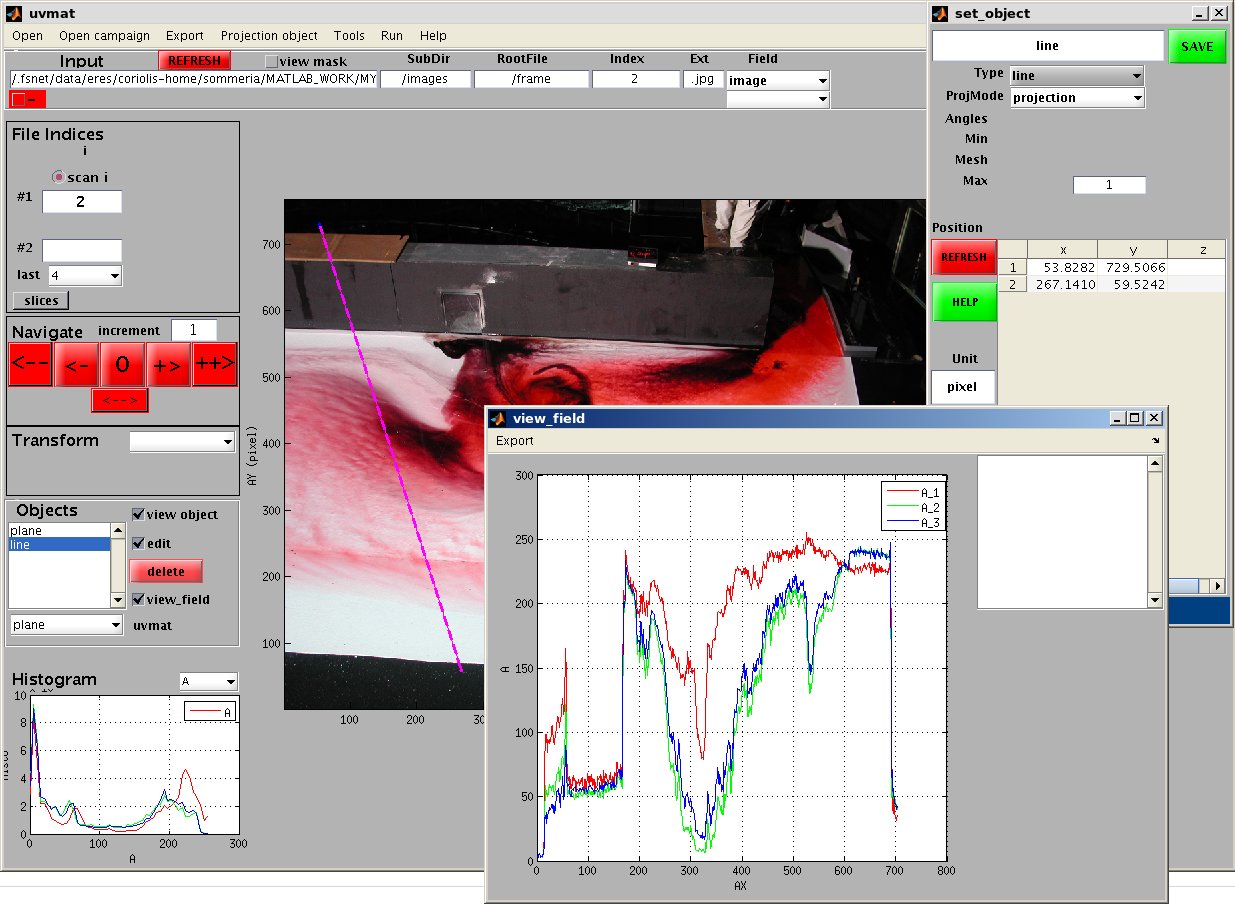
Create a line by the menu bar command [Projection object/line]. A new GUI set_object appears on the right side, with default settings [Type]='line', [ProjMode]='projection'. Draw a line with the mouse, press and release the left hand side button to mark the beginning and end of the line. The luminosity profile, with the three rgb image components, appears in a new GUI view_field. The following figure shows the main GUI uvmat, the GUI set_object which sets the object parameters, and the GUI view_field where the projected field is plotted:

These two GUIs can be made visible or not by selecting [CheckViewObject] or [CheckViewField] respectively in the frame [Objects] of uvmat.
Once created, the line can be moved with the mouse, or by directly introducing the coordinates of the line in the table [Position] of the GUI set_object. A line aligned with the x or y axis can be directly created by the menu bar command [Projection object/line_x] or [Projection object/line_y] respectively.
Getting the image histogram in a sub-region
This is obtained by creating a contour object, a polygon, a rectangle or an ellipse, using [Projection object/polygon], [Projection object/rectangle] or [Projection object/ellipse]. Draw the contour with the mouse to plot the histogram of the image inside the contour. To get the histogram of the region outside the contour, select the check box edit in the frame [Objects] of uvmat. Then in the GUI set_object, select 'outside' in the menu [ProjMode] and press the button [REFRESH].
Resampling the image
The image can be resampled by linear interpolation of image luminosity on a grid, by selecting [Projection object/plane_xy]. Then on the GUI set_object, select 'interp_lin' in the menu [ProjMode]. Set the mesh in x and y by the edit boxes [num_DX] and [num_DY], for instance with values 10, and press [REFRESH]. The image interpolated on this coarse grid is then displayed. It is also possible to reduce the range of x and y by the edit boxes [num_RangeX_1] and _2 and [num_RangeY_1] and _2. Finally it is also possible to rotate a projection plane by setting the angle (in degrees) in the edit box [num_Angle_3].
Attachments (1)
- set_object.jpg (183.5 KB) - added by 12 years ago.
Download all attachments as: .zip