
| Version 6 (modified by , 12 years ago) (diff) |
|---|
TracNav
- Tutorial2: Projection objects
- Tutorial1: Image display
- Tutorial3: Geometric calibration
- Tutorial4: Processing image series
- Tutorial5: Correlation Image Velocimetry: a simple example
- Tutorial6: Correlation Image Velocimetry: optimisation of parameters
- Tutorial7: Correlation Image Velocimetry for a turbulent series
- Tutorial8: Correlation Image Velocimetry: advanced features
- Tutorial9: Image Correlation for measuring displacements
- Tutorial10: Image Correlation for steroscopic vision
- Tutorial11: Correlation Image Velocimetry with 3 components
- Tutorial12: Comparaison with a Numerical Solution
Tutorial / Projection objects
Projection objects are used in various ways for image or field analysis, as shown in the following examples. Let us choose now a color image as input UVMAT_DEMO02_color/, for instance '/images/frame1.jpg'. (accessible on http://servforge.legi.grenoble-inp.fr/pub/soft-uvmat/)
We notice in this example that the frame index '1' directly follows the [RootFile] 'frame' (without separator '_'), so [NomType] is '1'. By moving the mouse over the image, we notice that the luminosity A has three color components rgb (red, green, blue). Similarly the histogram has three curves.
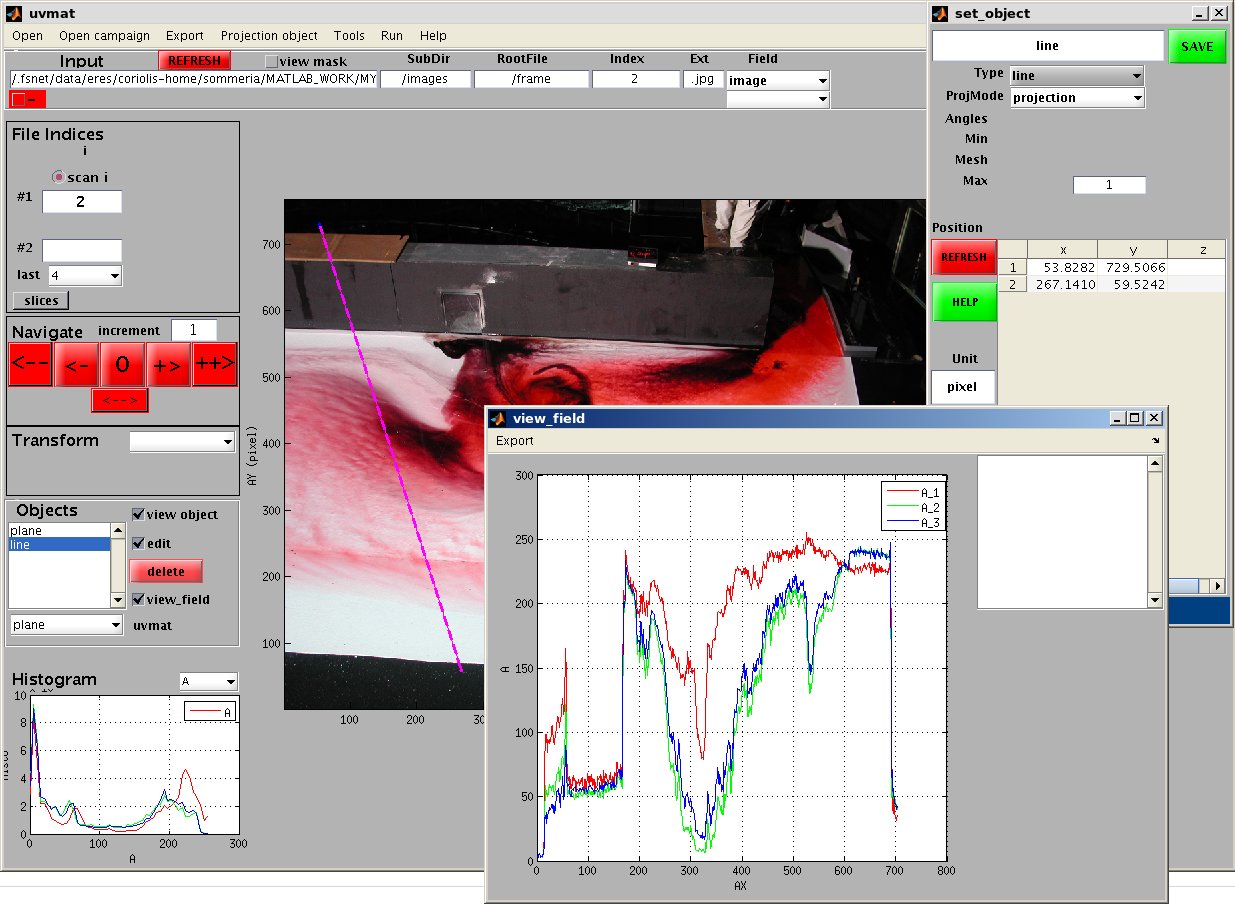
Plotting a luminosity profile
Create a line by the menu bar command 'Projection Object/line'. A new GUI 'set_object' appears on the right side, with default settings Type='line', ProjMode='projection'. Draw a line with the mouse, left hande side button to mark the beginning and end of the line. The luminosity profile, with the three rgb components, appears in a new GUI 'view_field'. The line can be moved with the mouse, or by directly introducing the coordinates of the line in the table [Coord] of the GUI set_object.
Getting the image histogram in a sub-region
Resampling the image
Attachments (1)
- set_object.jpg (183.5 KB) - added by 12 years ago.
Download all attachments as: .zip