
| Version 16 (modified by , 11 years ago) (diff) |
|---|
TracNav
- Tutorial9: Image Correlation for measuring displacements
- Tutorial1: Image display
- Tutorial2: Projection objects
- Tutorial3: Geometric calibration
- Tutorial4: Processing image series
- Tutorial5: Correlation Image Velocimetry: a simple example
- Tutorial6: Correlation Image Velocimetry: optimisation of parameters
- Tutorial7: Correlation Image Velocimetry for a turbulent series
- Tutorial8: Correlation Image Velocimetry: advanced features
- Tutorial10: Image Correlation for steroscopic vision
- Tutorial11: Correlation Image Velocimetry with 3 components
- Tutorial12: Comparaison with a Numerical Solution
Tutorial 9/ Image Correlation for measuring displacement
This demo shows how to use image correlation to measure a displacement versus time (instead of velocity). Open the image UVMAT_DEMO06_displacement (accessible on http://servforge.legi.grenoble-inp.fr/pub/soft-uvmat/).
Looking at the images
Open an image 'UVMAT_DEMO05_displacement/images'. This is a target pattern used to measure the displacement of a plate versus time. Observe the motion by scanning the images.
Make a mask to remove the outer part in the PIV processing, as explained in tutorial 5, or introduce the mask provided .ref (selecting the upper bar button [Projection object/browse..] in uvmat)
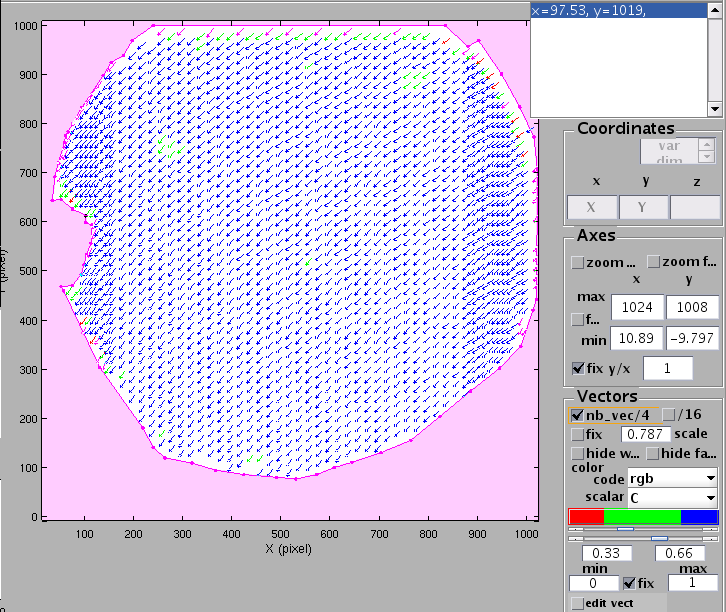
Civ in mode 'displacement'
Open series/civ_series and import the configuration from the reference file .ref. The appropriate parameters are then displayed:
- Select the mode 'displacement' from the menu [ListCompareMode], with respect the origin index 1 (first image by default). Then the menu for choosing image pairs on the right hand side desappears, as the correlation for each image are done with respect to the reference one, taken as origin for the displacement.
- Choose a fairly large correlation box, [CorrBox] =[31 31], corresponding to a coarse pattern, and considering that spatial resolution is not critical.
- Chosse a large search box, [Search] =[107 107] as we need to capture the maximum displacement.
- Select [CorrSmooth] =2 which corresponds to coarse 'particles': large correlation curves. See [!TestCiv1].
- Check the [Mask] box and select the mask made previous to isolate the active area.
- Chosse a fairly large [FieldSmooth] =20 (as spatial resolution is not critical) and no 'deformation' needed for [CIV2].
- Use the same correlation box, a smaller search zone (as we start form the prediction of Civ for Shift) in [CIV2], FIX2] and [PATCH2].

Observing the civ data
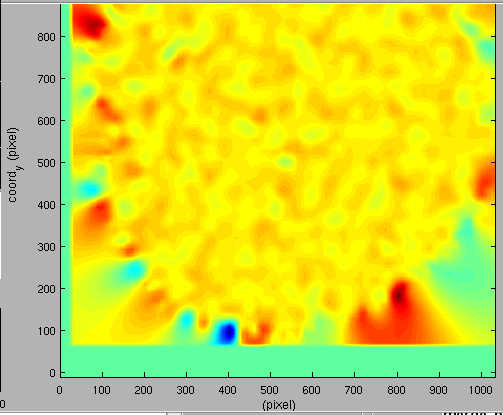
It is possible to show different data such as velocity, vorticity, divergence, strain etc from the previous results. Select from the menu bar tool [Field] the data needed and go through the different images using the arrows [<-] and [+>].
velocity, vorticity, div
The image below shows the vorticity of image 12:

Time series
Make a point, range=200, and run series/time series. Observe the curve displacement U and V versus time.
+ rotation + div
Attachments (2)
- Tutorial9 - Civ displacement.png (53.7 KB) - added by 11 years ago.
- Tutorial9 - Curl.png (30.3 KB) - added by 11 years ago.
Download all attachments as: .zip